Boosting audit quality: Key performance indicators guide
- John C. Blackshire, Jr.

- Apr 26
- 8 min read

TL;DR:
Audit quality indicators help assess and improve audit process performance effectively.
Combining quantitative and qualitative AQIs provides a comprehensive view of audit effectiveness.
Regular benchmarking and leadership engagement are essential for continuous audit quality improvement.
If you believe audit quality is stuck in neutral, recent data tells a different story. Deficiency rates dropped to 39% overall in PCAOB 2024 inspections, with global network firms reaching as low as 26%. That is a measurable shift, and it did not happen by accident. Internal auditors and compliance officers who are serious about driving performance need a structured approach to measurement, one grounded in audit quality indicators (AQIs). This guide explains what AQIs are, how to use them effectively, and what practical steps will help your team move the needle on audit quality.
Table of Contents
Key Takeaways
Point | Details |
AQIs drive improvement | Monitoring the right audit quality indicators can measurably boost audit performance and compliance. |
Benchmarking is essential | Use industry data like PCAOB findings to set realistic, achievable quality targets for internal audit teams. |
Qualitative insight matters | Blend numbers with qualitative feedback from audit teams and stakeholders for best results. |
Continuous training wins | Ongoing supervision and skills development are proven to lower audit deficiencies and raise standards. |
What are audit quality indicators and why do they matter?
Audit quality indicators are metrics used to assess how well an audit process is performing. They are not just scorecards. They are diagnostic tools that reveal where your team is strong, where it is falling short, and what changes are likely to produce better results.
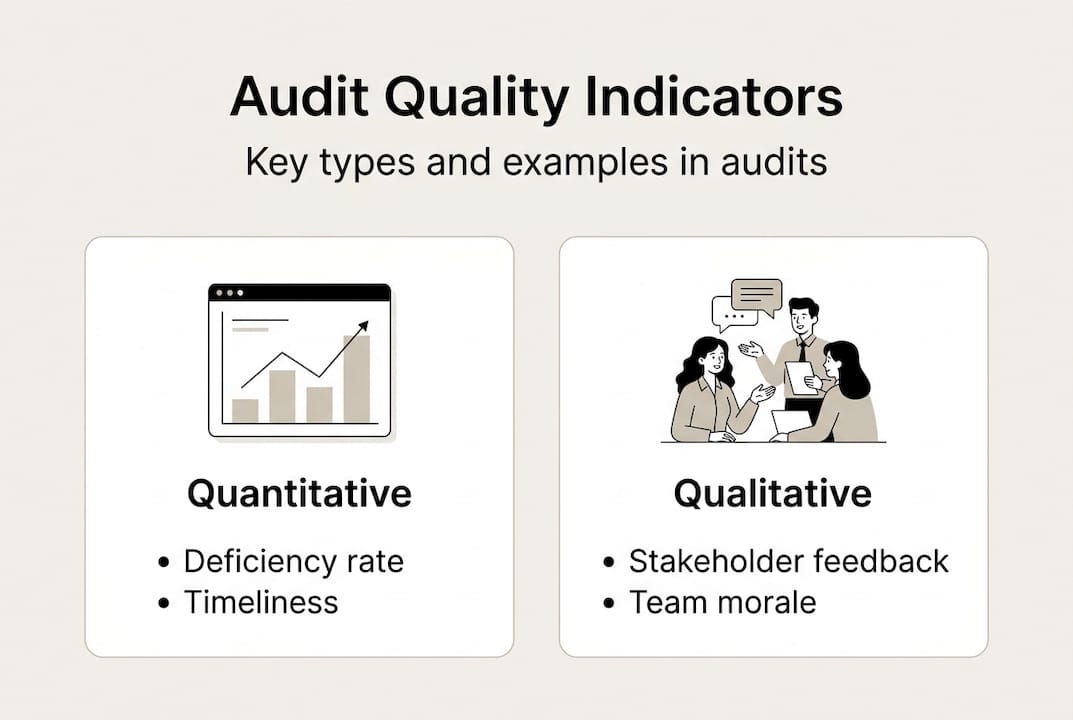
AQIs come in two broad forms. Quantitative indicators include measurable data points like deficiency rates, percentage of engagements completed on time, and hours of training per auditor. Qualitative indicators are less numeric but equally important. They capture things like stakeholder perceptions, the clarity of audit communication, and how well audit findings are understood and acted upon by management.
A common myth is that audit quality is largely subjective and therefore not measurable in any meaningful way. That is not accurate. While professional judgment will always play a role, much of what determines audit quality can be tracked, benchmarked, and improved with the right set of indicators.
Here are the primary categories of AQIs used by internal audit and compliance teams:
Deficiency and finding rates: How many engagements result in material findings or repeat findings.
Timeliness: Are audits completed on schedule? Are reports issued within defined windows?
Resource allocation: Are qualified personnel assigned appropriately to risk-rated engagements?
Training and development: Hours of CPE per auditor, certifications held, and skills alignment to assigned areas.
Supervision ratios: The balance between experienced and less experienced team members on engagements.
Qualitative feedback: Survey results from auditees, management, and audit committee members on communication quality and usefulness of findings.
For compliance officer tips on building a program that supports these measurements, the connection between AQIs and compliance effectiveness is direct.
“Empirical data on audit quality is limited; PCAOB benchmarks and qualitative feedback are both important tools for assessing and improving audit performance.”
The value here is that AQIs give you something to act on. Regulators, audit committees, and senior leadership increasingly expect audit functions to demonstrate their effectiveness, not just assert it. Without a structured indicator framework, that demonstration is nearly impossible.
Key audit quality indicators: Framework and leading examples
Now that the concept and value of AQIs is clear, let’s detail which indicators matter most and how leading teams select and apply them.

The table below outlines a practical framework of core AQIs, how each is measured, and its connection to audit performance.
AQI | How it is measured | Why it matters |
Deficiency rate | % of audits with significant findings | Tracks alignment with PCAOB and internal thresholds |
Timeliness | % of audits completed within planned schedule | Reflects planning effectiveness and resource management |
Training hours | CPE hours per auditor annually | Supports competency and regulatory compliance |
Supervision ratio | Senior-to-staff auditor ratio per engagement | Affects review quality and risk coverage |
Repeat findings | % of prior-year findings reappearing | Signals root cause gaps or management response issues |
Qualitative survey score | Average rating from auditees and audit committee | Captures perceived value and communication quality |
For context, PCAOB deficiency benchmarks show a target of under 26% for major global network firms, giving internal teams a useful reference point even though the PCAOB inspects registered public accounting firms, not internal audit departments. Understanding common deficiency areas in Big 4 inspections gives internal auditors a preview of where standards are being applied most rigorously.
When selecting AQIs for your organization, keep these do’s and don’ts in mind:
Do align indicators to your organization’s risk profile and strategic objectives.
Do include both quantitative and qualitative metrics in every review cycle.
Do review your AQI set annually to confirm it still reflects current audit priorities.
Don’t choose so many indicators that reporting becomes burdensome without adding insight.
Don’t rely solely on deficiency rates. They measure problems after the fact, not process quality in real time.
Don’t ignore the frequent audit standards that regulators reference most, as these signal where your qualitative metrics need the most attention.
Pro Tip: Always include at least one qualitative feedback metric alongside your quantitative data. Numbers tell you what happened; stakeholder feedback tells you why. Together, they give you the full picture.
Benchmarking your audit quality: Setting targets and tracking progress
After outlining what to measure, it is time to translate AQIs into clear goals you can actually track and demonstrate.
Benchmarking is the practice of comparing your team’s AQI results against external standards or industry norms. The PCAOB’s annual inspection data is the most authoritative public benchmark available for audit quality in the U.S. While it focuses on registered audit firms, the deficiency rate data is directly instructive. Deficiency rates for global network firms dropped to 26%, establishing a concrete target that serious audit functions should aspire to match or beat for their own internal processes.
The following comparison illustrates how benchmarks can be applied internally:
AQI metric | PCAOB GNF benchmark | U.S. industry median (estimate) | Sample internal team rate |
Deficiency rate | 26% | 35% | 41% |
Timeliness | Not published | 85% on-time | 78% on-time |
Training hours | Not published | 40 hrs/year | 32 hrs/year |
Qualitative score | Not published | 3.8 / 5.0 | 3.4 / 5.0 |
Reading that table clearly identifies where the sample team has the most room to grow: deficiency rate and training hours first, then timeliness.
Here is a three-step benchmarking process you can apply starting today:
Collect: Gather your current AQI data across all active indicators for the most recent completed audit cycle. Be honest and complete. Gaps in data are findings in themselves.
Compare: Measure your results against relevant benchmarks. Use PCAOB data for deficiency context and look at industry issues in PCAOB inspections for sector-specific risk patterns that may be affecting your team.
Calibrate: Adjust your targets and processes based on what the gap analysis reveals. Set achievable 12-month improvement goals for each lagging indicator.
One important caution: resist the temptation to treat benchmarking as a number-matching exercise. A deficiency rate of 25% may look good on paper, but if your team is avoiding challenging engagements to protect that rate, you are gaming the metric rather than improving audit quality. Context matters. Always interpret your AQI data alongside knowledge of your audit universe and risk environment.
Best practices for applying and improving audit quality indicators
Knowing how to set goals is key, but execution separates the best teams from the rest.
Applying AQIs effectively is not a one-time project. It requires ongoing commitment from audit leadership, consistent communication across the team, and a willingness to act on what the data reveals. Audit quality gains are directly linked to improved supervision, training, and resource allocation, which means those three levers should be at the center of your improvement plan.
Here are five best practices that consistently move the needle:
Invest in continuous training: Schedule CPE around the specific standards and skills gaps your AQIs reveal. Generic training fills hours; targeted training improves results.
Make reporting transparent: Share AQI results with the audit committee and senior leadership. Visibility creates accountability at every level.
Secure leadership buy-in early: If the chief audit executive is not actively engaged with AQI results, the rest of the team will treat them as administrative noise.
Review indicators regularly: Do not wait until year-end. Quarterly AQI reviews allow you to course-correct before small gaps become systemic problems.
Integrate qualitative data: Combine numerical results with feedback from auditees and the audit committee. Both are necessary inputs for a complete picture.
For guidance on strengthening the leadership dimension of your audit function, the resource on audit team leadership offers practical frameworks that complement AQI measurement.
Pro Tip: Establish a recurring feedback loop with all audit stakeholders, not just leadership. Auditees who feel heard are more likely to engage constructively with findings, which directly improves the value of your audit work.
Resistance to change is the most common obstacle audit teams face when implementing AQIs. Some team members see measurement as surveillance rather than support. The way to address that is through clear communication: AQIs are not about grading individuals. They are about improving the system that everyone operates within.
What most guides miss about audit quality indicators
Most AQI discussions focus almost entirely on metrics: deficiency rates, training hours, timelines. Those numbers matter. But experienced auditors know that the data is only as reliable as the culture producing it.
Here is what often gets missed: if your audit team does not trust leadership to use AQI data fairly, people will manage the metric rather than improve the work. That is how you end up with a 24% deficiency rate and an audit function that is quietly avoiding difficult engagements.
The qualitative factors that truly distinguish high-performing audit functions include trust in audit leadership, a genuine feedback culture, and cross-functional collaboration with finance, operations, and IT. These cannot be fully captured in a spreadsheet, but they are often the deciding factor between an audit function that improves and one that stagnates.
For practical compliance insights that connect culture to program effectiveness, the link between organizational trust and audit quality is well-established. Our advice: do not treat AQIs as a performance management system. Treat them as a professional conversation starter. The number opens the door. The dialogue is where transformation actually happens.
Take your audit quality to the next level
If you are ready to turn AQI knowledge into measurable improvements, structured professional development is the most direct path forward.
At Compliance Seminars, we offer CPE webinars for auditors that go beyond theory and focus on the practical application of audit quality frameworks, supervision standards, and deficiency reduction strategies. Whether you are a chief audit executive building a measurement program or a compliance officer strengthening your team’s technical foundation, our NASBA-recognized courses are designed to deliver real results. Browse the 2026 CPE event calendar to find in-person and live webinar options that fit your schedule and your organization’s learning priorities.
Frequently asked questions
What are the most commonly used audit quality indicators?
The most common AQIs include deficiency rates, training, and supervision metrics, along with timeliness rates and qualitative survey feedback from auditees and audit committees.
How do you set practical targets for audit quality indicators?
Benchmark your AQIs against PCAOB and industry data; the GNF deficiency benchmark of under 26% is a strong starting reference point for major audit engagements.
Why include qualitative feedback in audit quality measurement?
Qualitative feedback remains essential because it captures the context and stakeholder perspective that numbers alone cannot reveal, giving you a fuller picture of actual audit effectiveness.
What is the impact of training and supervision on audit quality?
Improved training and supervision are directly tied to lower deficiency rates; better training and resources are consistently cited in PCAOB inspection findings as drivers of measurable audit quality gains.
Recommended
Comments